Data as of September 30, 2025. The performance data quoted represents past performance and is no guarantee of future results. Investment return and principal value of an investment will fluctuate so that an investor’s shares, when redeemed, may be worth more or less than their original cost. Current performance may be lower or higher than the performance data quoted. For the most recent month-end performance, please call 800-527-9525.
The Fund acquired the assets and assumed the historical performance of another mutual fund (the “Predecessor Fund”) on December 16, 2002. The performance shown in the table for periods between that date and November 25, 2005 is the performance of the Predecessor Fund. On December 16, 2002, the Predecessor Fund acquired the assets of an unregistered, similarly managed investment company (the “Partnership”). Performance prior to that date is that of the Partnership. The Partnership was not subject to the same investment and tax restrictions as the Predecessor Fund or the Fund; if it had been, the Partnership’s performance may have been lower. Additionally, on August 15, 2014, the Fund was reorganized from a series of World Funds, Inc., a Maryland corporation, to a series of the Trust, a Delaware statutory trust (the “Reorganization”). The performance information shown below is based upon the average total returns of the Fund (which, as noted above, includes the performance of the Fund prior to the Reorganization). The performance information below is intended to serve as an illustration of the variability of the Fund’s returns. The Fund’s fee and expense structure prior to the Reorganization was different and could have impacted results.
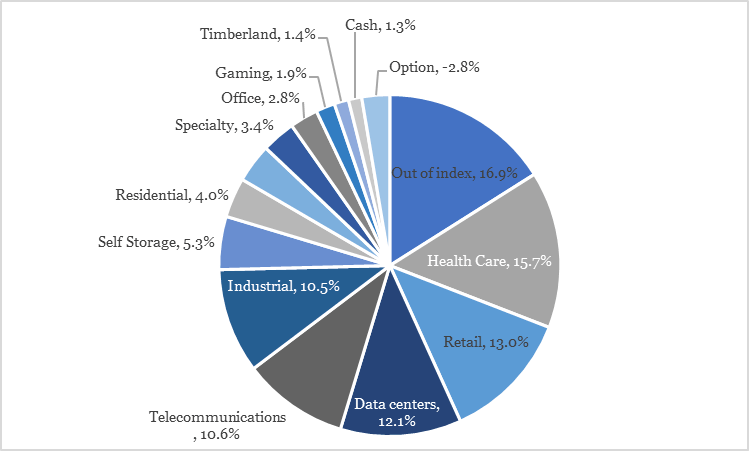
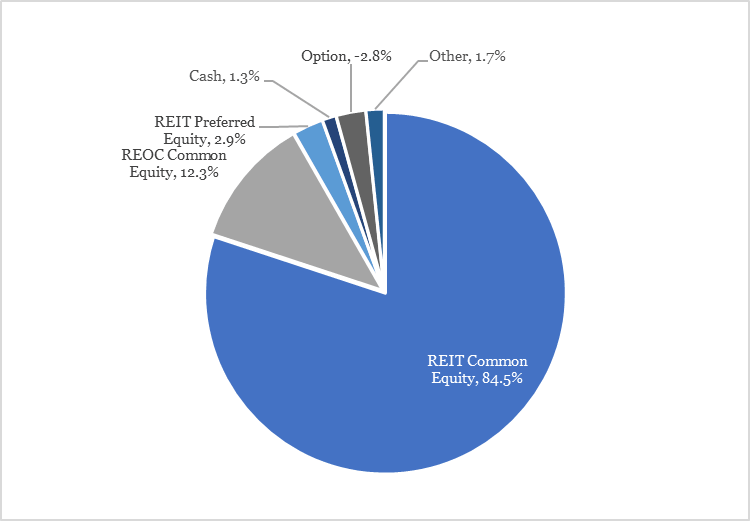
Data as of September 30, 2025. Real Estate Investment Trust (REIT): A company that purchases and manages real estate and/or real estate loans. SEC 30-Day Yield is calculated by dividing the net investment income earned over the past 30 days by the maximum offering price per share on the last day of that period. Dividend yield is calculated by dividing the most recent quarter’s dividend by the closing price of each security at the end of the quarter. Median Market Cap: The midpoint of market capitalization of the stocks in a portfolio. Weighted Market Cap: Each stock in a portfolio is weighted according to the size of its total market capitalization. Standard Deviation: Measures the degree to which a fund’s performance has varied from its average performance over a particular time period. The greater the standard deviation, the greater the fund’s volatility (risk). Sharpe Ratio: Sharpe ratio uses a fund’s excess return (difference between the fund’s return and the risk-free return of 90-day Treasury Bills) divided by its standard deviation (a measure of risk) to determine its reward per unit of risk. Alpha: Alpha is a measure of a fund’s excess return on a risk-adjusted basis. An alpha above 0 means that the fund has outperformed the benchmark index on a risk-adjusted basis. Beta: Beta measures the fund’s sensitivity to market movements. Beta greater than 1 is more volatile than the benchmark and beta less than 1 is less volatile than the benchmark. Correlation: Measures the extent to which a fund and its benchmark index move in tandem with each other. Tracking Error: Measures how closely a fund’s return follows the benchmark index returns. It’s calculated as the standard deviation of the difference between the fund and the index returns. Information Ratio: Measures the excess return of a fund divided by the amount of risk the fund takes relative to the benchmark index. The higher the information ratio, the higher the excess return expected of the fund, given the amount of risk involved. Upside Capture: Represents the fund’s performance relative to the index when the index is up – a value of over 100 means that the fund has outperformed the index when the index was up. Downside Capture: Represents the fund’s performance when the index is down – a value of less than 100 means the fund was not down as much as the index on the days when the index is down.
Past performance is no guarantee of future results. Different types of investments involve varying degrees of risk, and there can be no assurance that any specific investment will either be suitable or profitable for a client. Economic factors, market conditions, and investment strategies will affect the performance of any portfolio and there are no assurances that it will match or outperform any particular benchmark. All market indexes quoted in this newsletter are unmanaged. Unlike managed strategies, the performance of an index does not reflect taxes, transaction costs, management fees or other expenses. It is not possible to invest directly in an index. Dividends are not guaranteed and may fluctuate.